Art of Sound
Year — Fall 2024
Tools — HTML, CSS, JavaScript (p5js.Sound)
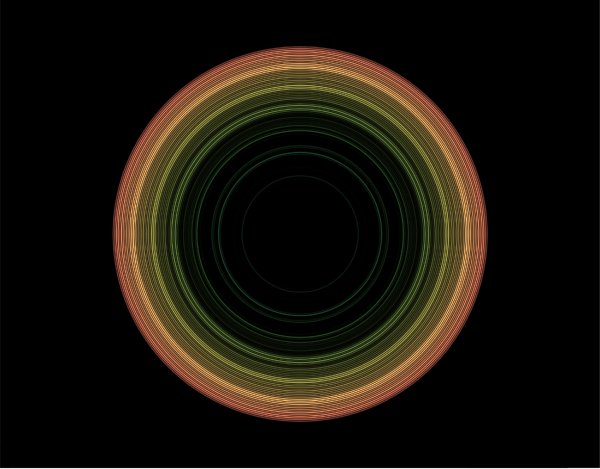
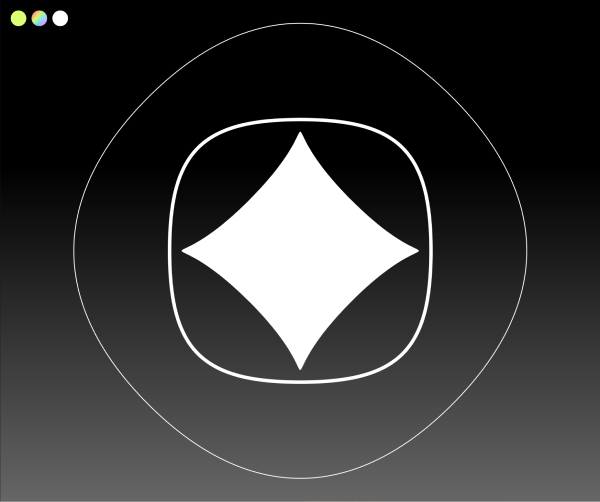
Synopsis — An interactive sound visualization experience that generates real-time graphics with fast Fourier transforms.
Music credit: Sad Piano Lost Love by WaveMaster (Pixabay)
Scoping ...and Descoping
For this project, I wanted to transform sound into visuals through creative and experimental coding. I originally intended to make this an app(let) that could run in the background and listen to Spotify or YouTube on the user's computer. Consider it the visual equivalent of lofi study music.
However, I quickly discovered that browsers are fickle things. At my level of programming ability, browser security would immediately mute any other tabs.
So I changed the scope to microphone input. If need be, you can play the music on another device and use the original device's microphone and display.